In this tutorial we will show you how to properly install and configure one of the most popular Grafana + Prometheus monitoring system. We will do the installation in Docker. We will go through all the steps of the installation and at the end of the article you will find a compose file for a quick installation.
Installing Grafana
To install the latest stable version of Grafana, just run the following command
docker run -d -p 3000:3000 --name grafana grafana/grafana-enterprise
After the installation is complete, the web interface will be available at http://ip:3000. You will need to enter your admin login and admin password, after which you will be prompted for a new password.
Installing Prometheus + Node Exporter
Let’s install Prometheus and to collect statistics from the host system (the system on which the Grafana server is installed) we will additionally install Node Exporter.
To simplify the installation, we will create a docker-compose.yml file with the following contents:
version: '3.3'

networks:
  monitoring:
    driver: bridge

volumes:
  prometheus_data: {}

services:
  node-exporter:
    image: prom/node-exporter:latest
    container_name: node-exporter
    restart: unless-stopped
    volumes:
      - /proc:/host/proc:ro
      - /sys:/host/sys:ro
      - /:/rootfs:ro
    command:
      - '--path.procfs=/host/proc'
      - '--path.rootfs=/rootfs'
      - '--path.sysfs=/host/sys'
      - '--collector.filesystem.mount-points-exclude=^/(sys|proc|dev|host|etc)($$|/)'
    ports:
      - 9100:9100
    networks:
      - monitoring
  prometheus:
    image: prom/prometheus:latest
    container_name: prometheus
    restart: unless-stopped
    volumes:
      - ./prometheus.yml:/etc/prometheus/prometheus.yml
      - prometheus_data:/prometheus
    command:
      - '--config.file=/etc/prometheus/prometheus.yml'
      - '--storage.tsdb.path=/prometheus'
      - '--web.console.libraries=/etc/prometheus/console_libraries'
      - '--web.console.templates=/etc/prometheus/consoles'
      - '--web.enable-lifecycle'
    ports:
      - 9090:9090
    networks:
      - monitoring
To collect Node Exporter statistics we mounted /proc /sys and / in read mode.
For Prometheus, we need to specify the folder where the prometheus.yml configuration file will be located. In the example above, the path is specified to the root folder from which the compose file will be launched.
Create a directory prometheus in which we create the file prometheus.yml with the following contents:
global:
  scrape_interval:     15s

scrape_configs:
  - job_name: "prometheus"
    scrape_interval: 5s
    static_configs:
    - targets: ["localhost:9090"]

  - job_name: "node"
    static_configs:
    - targets: ["node-exporter:9100"]
Let’s go back to the level above where the docker-compose.yml file is and install
docker-compose up -d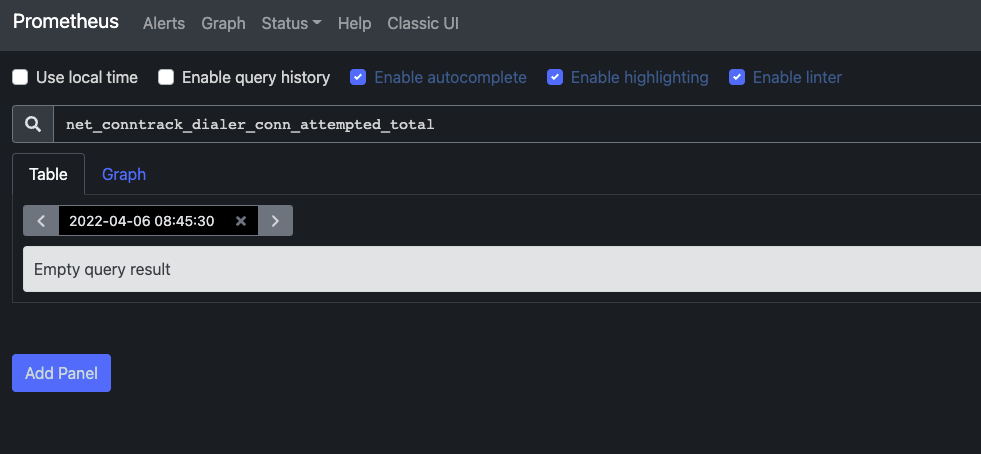
After installation, check the availability of Prometheus, which will be available at http://ip:9090, and the metrics that are collected on the host system will be available at http://ip:9100.
Now the last step is to add Prometheus to Grafana as a data source.
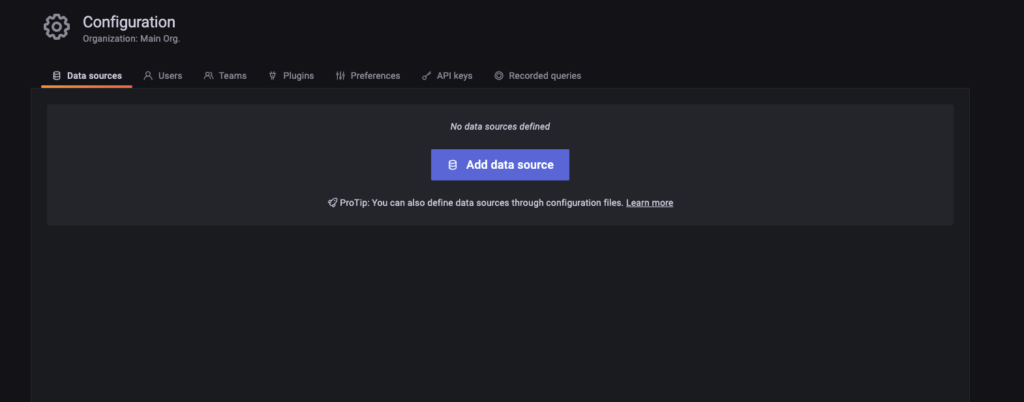
Go to Grafana – Configuration – Data sources and click Add data source and select Prometheus.
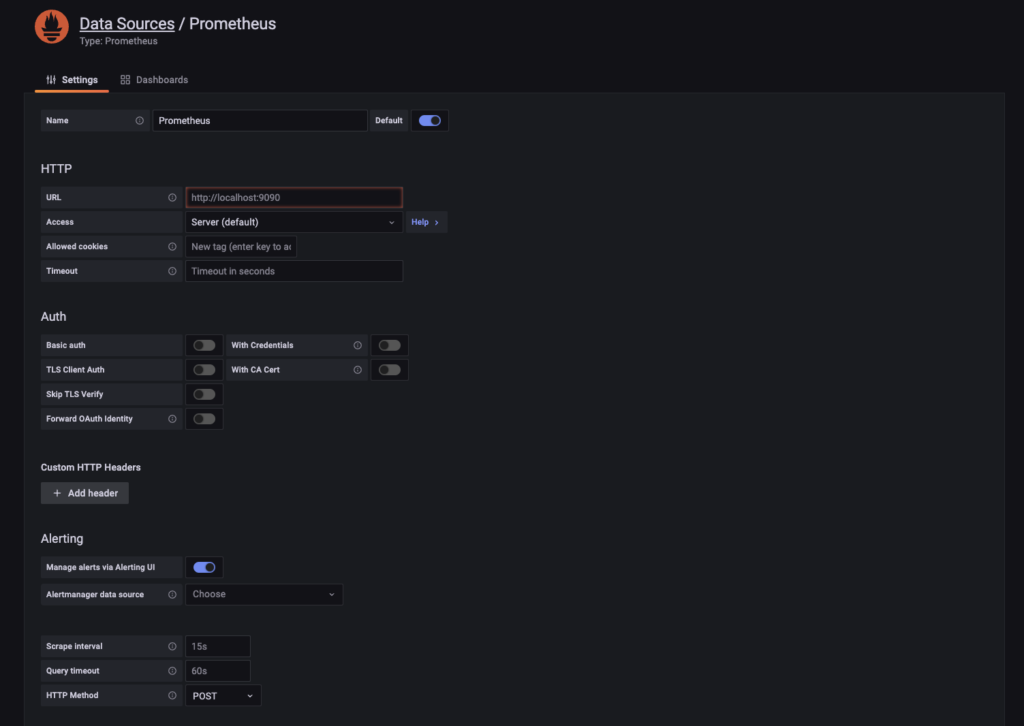
In the URL field enter the address and port on which Prometheus is available, in our case it is http://ip:9090

Scroll to the bottom of the page and click Save& test and after a successful test Prometheus will be added to Grafana.
The last step of the installation is to install the Node Exporter dashboard to collect statistics from the host system.
Go to Dashboards (four squares on the side menu) – Brows – and click Import.
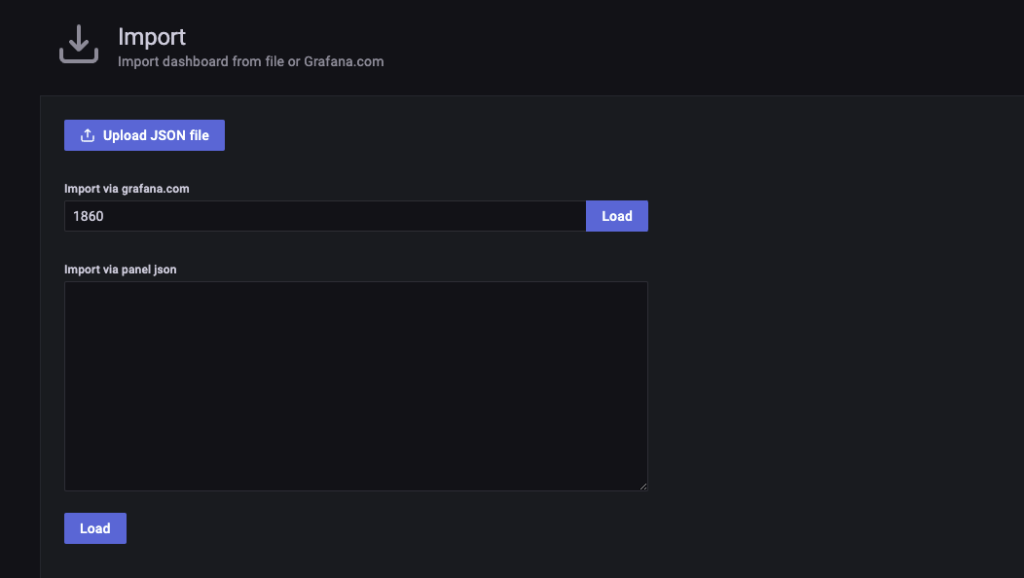
In the import field specify ID 1860 and click Load
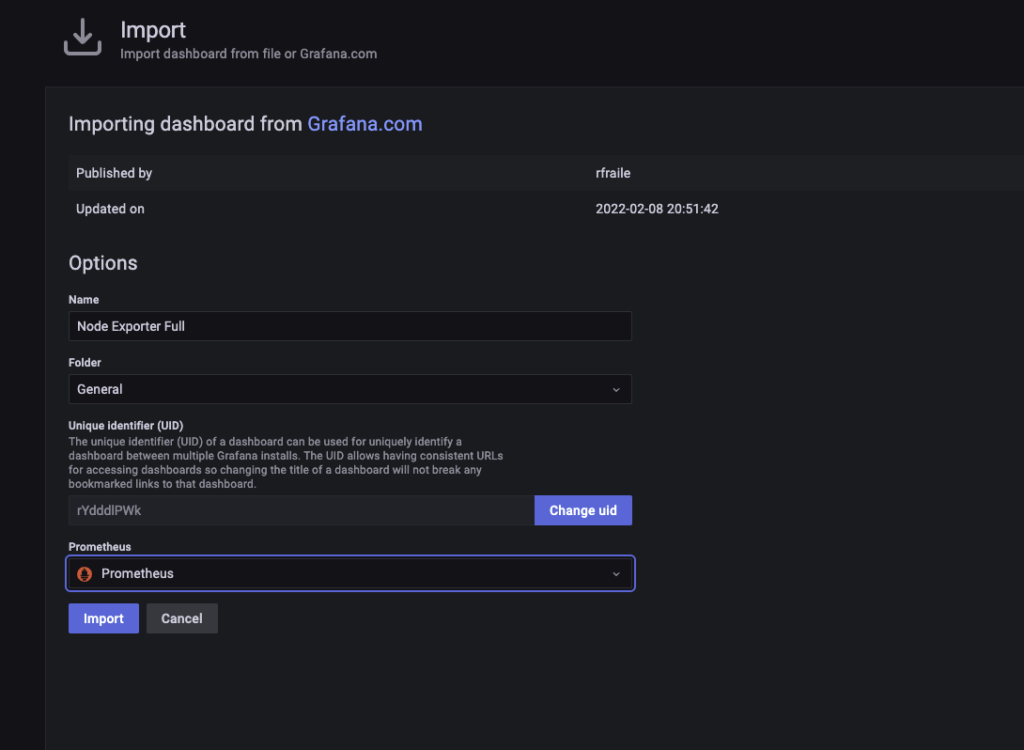
We will be prompted to change the name of the dashboard and the folder in which it will be located and in the Prometheus field you must select the name of the data source that we added.
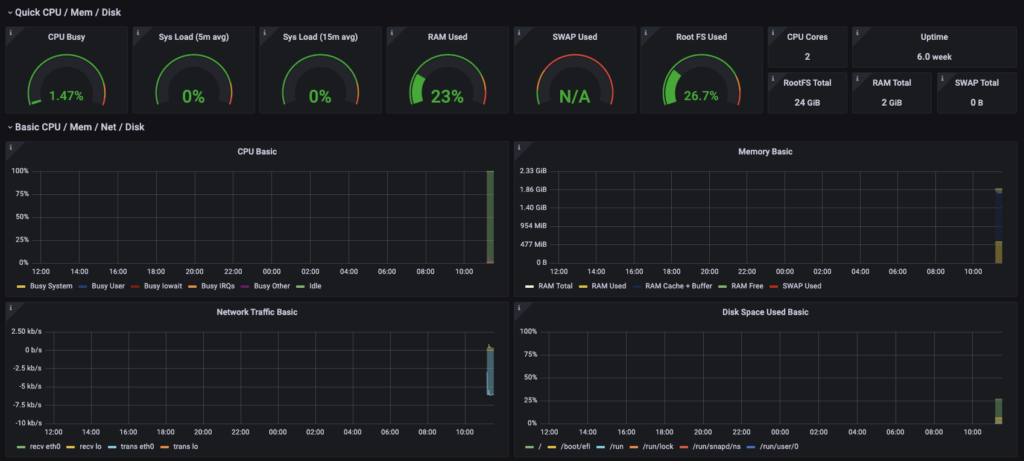
After you click the Import button you get to the installed dashboard, which will already display the collected data.
In order to install the whole bundle, you must create a file docker-compose.yml in which you must add the following
version: '3.3'

networks:
  monitoring:
    driver: bridge

volumes:
  prometheus_data: {}

services:
  node-exporter:
    image: prom/node-exporter:latest
    container_name: node-exporter
    restart: unless-stopped
    volumes:
      - /proc:/host/proc:ro
      - /sys:/host/sys:ro
      - /:/rootfs:ro
    command:
      - '--path.procfs=/host/proc'
      - '--path.rootfs=/rootfs'
      - '--path.sysfs=/host/sys'
      - '--collector.filesystem.mount-points-exclude=^/(sys|proc|dev|host|etc)($$|/)'
    ports:
      - 9100:9100
    networks:
      - monitoring
  grafana:
    image: grafana/grafana-enterprise
    container_name: grafana
    restart: unless-stopped
    ports:
      - 3000:3000
  prometheus:
    image: prom/prometheus:latest
    container_name: prometheus
    restart: unless-stopped
    volumes:
      - ./prometheus.yml:/etc/prometheus/prometheus.yml
      - prometheus_data:/prometheus
    command:
      - '--config.file=/etc/prometheus/prometheus.yml'
      - '--storage.tsdb.path=/prometheus'
      - '--web.console.libraries=/etc/prometheus/console_libraries'
      - '--web.console.templates=/etc/prometheus/consoles'
      - '--web.enable-lifecycle'
    ports:
      - 9090:9090
    networks:
      - monitoring
And execute the command:
docker-compose up -d